Search Results:
Association rule mining - explained
posted on 14 Jun 2020 under category tutorial
What is Association Rule Mining
Association rule mining is primarily focused on finding frequent co-occurring associations among a collection of items. It is sometimes referred to as “Market Basket Analysis”, since that was the original application area of association mining. The goal is to find associations of items that occur together more often than you would expect from a random sampling of all possibilities. The classic example of this is the famous Beer and Diapers association that is often mentioned in data mining books. The story goes like this: men who go to the store to buy diapers will also tend to buy beer at the same time.
Some examples are listed below:
- Market Basket Analysis is a popular application of Association Rules.
- People who visit webpage X are likely to visit webpage Y
- People who have age-group [30,40] & income [>$100k] are likely to own home
An association rule has 2 parts:
- an antecedent (if) and
- a consequent (then) An antecedent is something that’s found in data, and a consequent is an item that is found in combination with the antecedent. Have a look at this rule for instance:
“If a customer buys bread, he’s 70% likely of buying milk.”
In the above association rule, bread is the antecedent and milk is the consequent. Simply put, it can be understood as a retail store’s association rule to target their customers better. If the above rule is a result of a thorough analysis of some data sets, it can be used to not only improve customer service but also improve the company’s revenue. Association rules are created by thoroughly analyzing data and looking for frequent if/then patterns.
Association mining is usually done on transactions data from a retail market or from an online e-commerce store. Since most transactions data is large, the apriori algorithm makes it easier to find these patterns or rules quickly.
So, What is a rule?
A rule is a notation that represents which item/s is frequently bought with what item/s. It has an LHS and an RHS part and can be represented as follows:
itemset A => itemset B
This means, the item/s on the right were frequently purchased along with items on the left.
How to measure the strength of a rule?
The apriori algorithm, most common algorithm of ARM generates the most relevent set of rules from a given transaction data. It also shows the support, confidence and lift of those rules. These three measure can be used to decide the relative strength of the rules. So what do these terms mean?
Lets consider the rule A => B in order to compute these metrics.

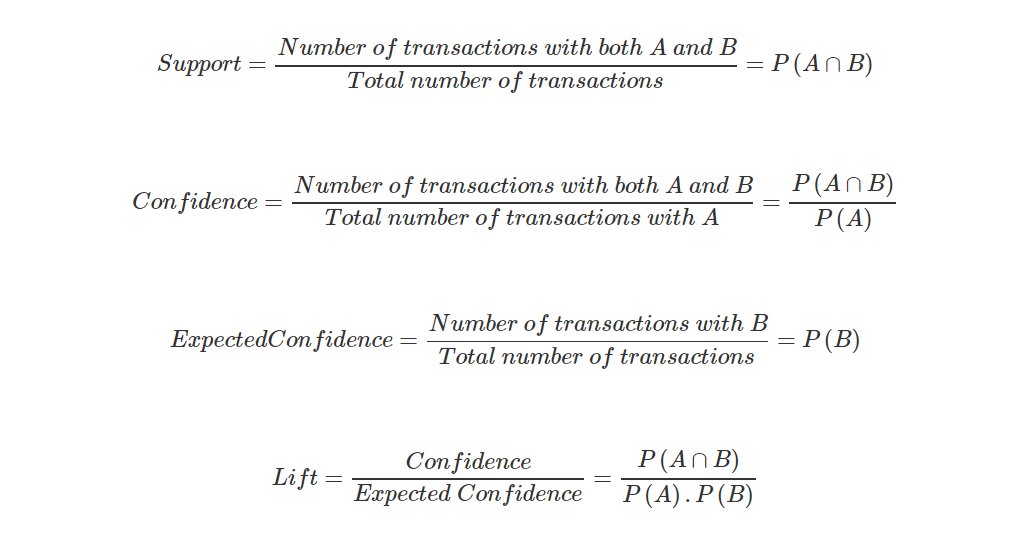
Support: Support indicates how frequently the if/then relationship appears in the database. Confidence: Confidence tells about the number of times these relationships have been found to be true. Lift:Lift is the factor by which, the co-occurence of A and B exceeds the expected probability of A and B co-occuring, had they been independent. So, higher the lift, higher the chance of A and B occurring together.
Other measures include Conviction, All-Confidence, Collective strength and Leverage.
Mathematics Involved
Problem can be seen as:
- Let I = {i_1,i_2,….} be a set of binary attributes called items.
- Let D = {t_1,t_2,….} be a set of transactions called the database.
- Each transaction in D contains a subset of items in I.
Simple rule looks like -
t_1 ⇒ t_2 (Here, t_i is generally a single item or a set of items) *t1: Antecedent, t2: Consequent
Supermarket Example
I = {milk, bread, butter, beer, diapers} D is as shown below:

Rule: {butter, bread} ⇒ {milk}, meaning that if butter and bread are bought, customers also buy milk.
Thresholds used for Relations
- Support — Indication of how frequently the itemset appears in the database. It is defined as the fraction of records that contain X∪Y to the total number of records in the database. Suppose, the support of an item is 0.1%, it means only 0.1% of the transactions contain that item. Support (XY) = Support count of (XY) / Total number of transaction in D
- Confidence — Fraction of the number of transactions that contain X∪Y to the total number of records that contain X. It’s is a measure of strength of the association rules. Suppose, the confidence of the association rule X⇒Y is 80%, it means that 80% of the transactions that contain X also contain Y together.
Confidence (X Y) = Support (XY) / Support (X)
Algorithms for Association Rule Mining
Apriori:
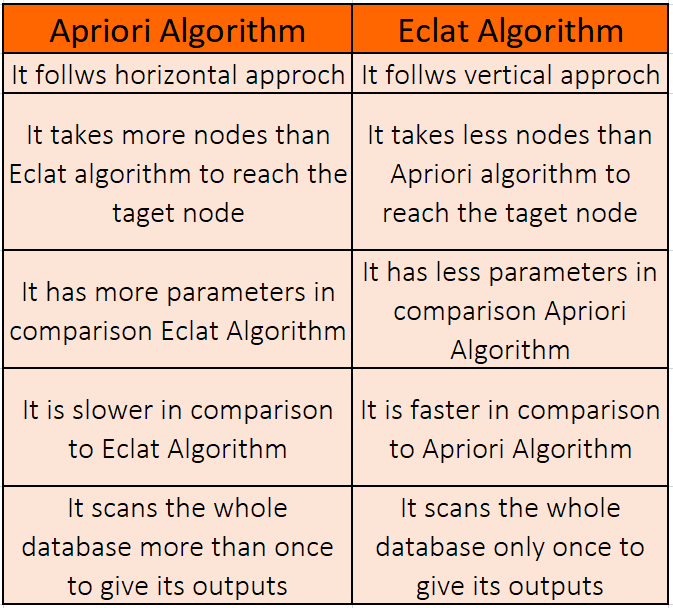
Uses a breadth-first search strategy to count the support of itemsets and uses a candidate generation function which exploits the downward closure property of support. Apriori has three parts that we disucssed above.
The algorithm then proceeds in the following steps:
- Set a minimum support and confidence, mainly due to immense number of combinations
- Take all subsets in the transactions having more support than the minimum support
- Take all subsets in the transactions having more confidence than the minimum confidence
- Sort the rules by decreasing order of lift
It must be kept in mind that the values of Support, Life and Confidence may seem mathematical in the equations above, but are experimental in nature. We choose a value for the parameters, run some the algorithm and then change the value of those parameters and run the algorithm again. We base these values on the empirical data, i.e. the set of rules obtained in this example.
Pros
- Least memory consumption.
- Easy implementation.
- Uses Apriori property for pruning, therefore, itemsets left for further support checking remain less. Cons
- Requires many scans of database.
- Allows only single minimum support threshold.
- Favourable for small databases.
Eclat
In the eclat model, we only have support. When we calculate the support, in an Eclat model, we are consider the prevalence of a set of items and not individual models. This makes sense because in case of Eclat models, since we only have support, the individual items is just the frequency of the items and nothing more than that.
The algorithm, as one would intuitively assume it to, works as follows:
- Set a minimum support
- Select all subsets of transactions having support more than the minimum support
- Sort these subsets by decreasing order of support

Frequent-Pattern Growth: (FP)
Frequent-Pattern Growth algorithm works in the following manner-
- In the first pass, FP Growth algorithm counts occurrence of items (attribute-value pairs) in the dataset, and stores them to header table.
- In the second pass, it builds the FP-tree structure by inserting instances. Items in each instance have to be sorted by descending order of their frequency in the dataset, so that the tree can be processed quickly.
- Items in each instance that do not meet minimum coverage threshold are discarded. If many instances share most frequent items, FP-tree provides high compression close to tree root.
- Recursive processing of this compressed version of main dataset grows large item sets directly, instead of generating candidate items and testing them against the entire database. Growth starts from the bottom of the header table (having longest branches), by finding all instances matching given condition. New tree is created, with counts projected from the original tree corresponding to the set of instances that are conditional on the attribute, with each node getting sum of its children counts. Recursive growth ends when no individual items conditional on the attribute meet minimum support threshold, and processing continues on the remaining header items of the original FP-tree.
- Once the recursive process has completed, all large item sets with minimum coverage have been found, and association rule creation begins.
Pros
- Faster than other ARM algorithm.
- Uses compressed representation of original database.
- Repeated database scan is eliminated. Cons
- More memory consumption.
- Not for interactive or incremental mining.
- Resulting FP-Tree is not unique for same logical database.

References
- A Review on Association Rule Mining Algorithms by Jyoti Arora, Nidhi Bhalla and Sanjeev Rao
- Blogs by Mapr, Aimotion and AV
- Association Rule Mining: A Survey by Gurneet Kaur
