Search Results:
Classification - explained
posted on 11 Jun 2020 under category tutorial
Classification
In this post, we will study classification algorithm, firstly, we will understand what is Classification and then we will get into the difference between classification and regression, evaluation of classification algorithms and then we will explore the algorithms for classification one by one in the next blogs.
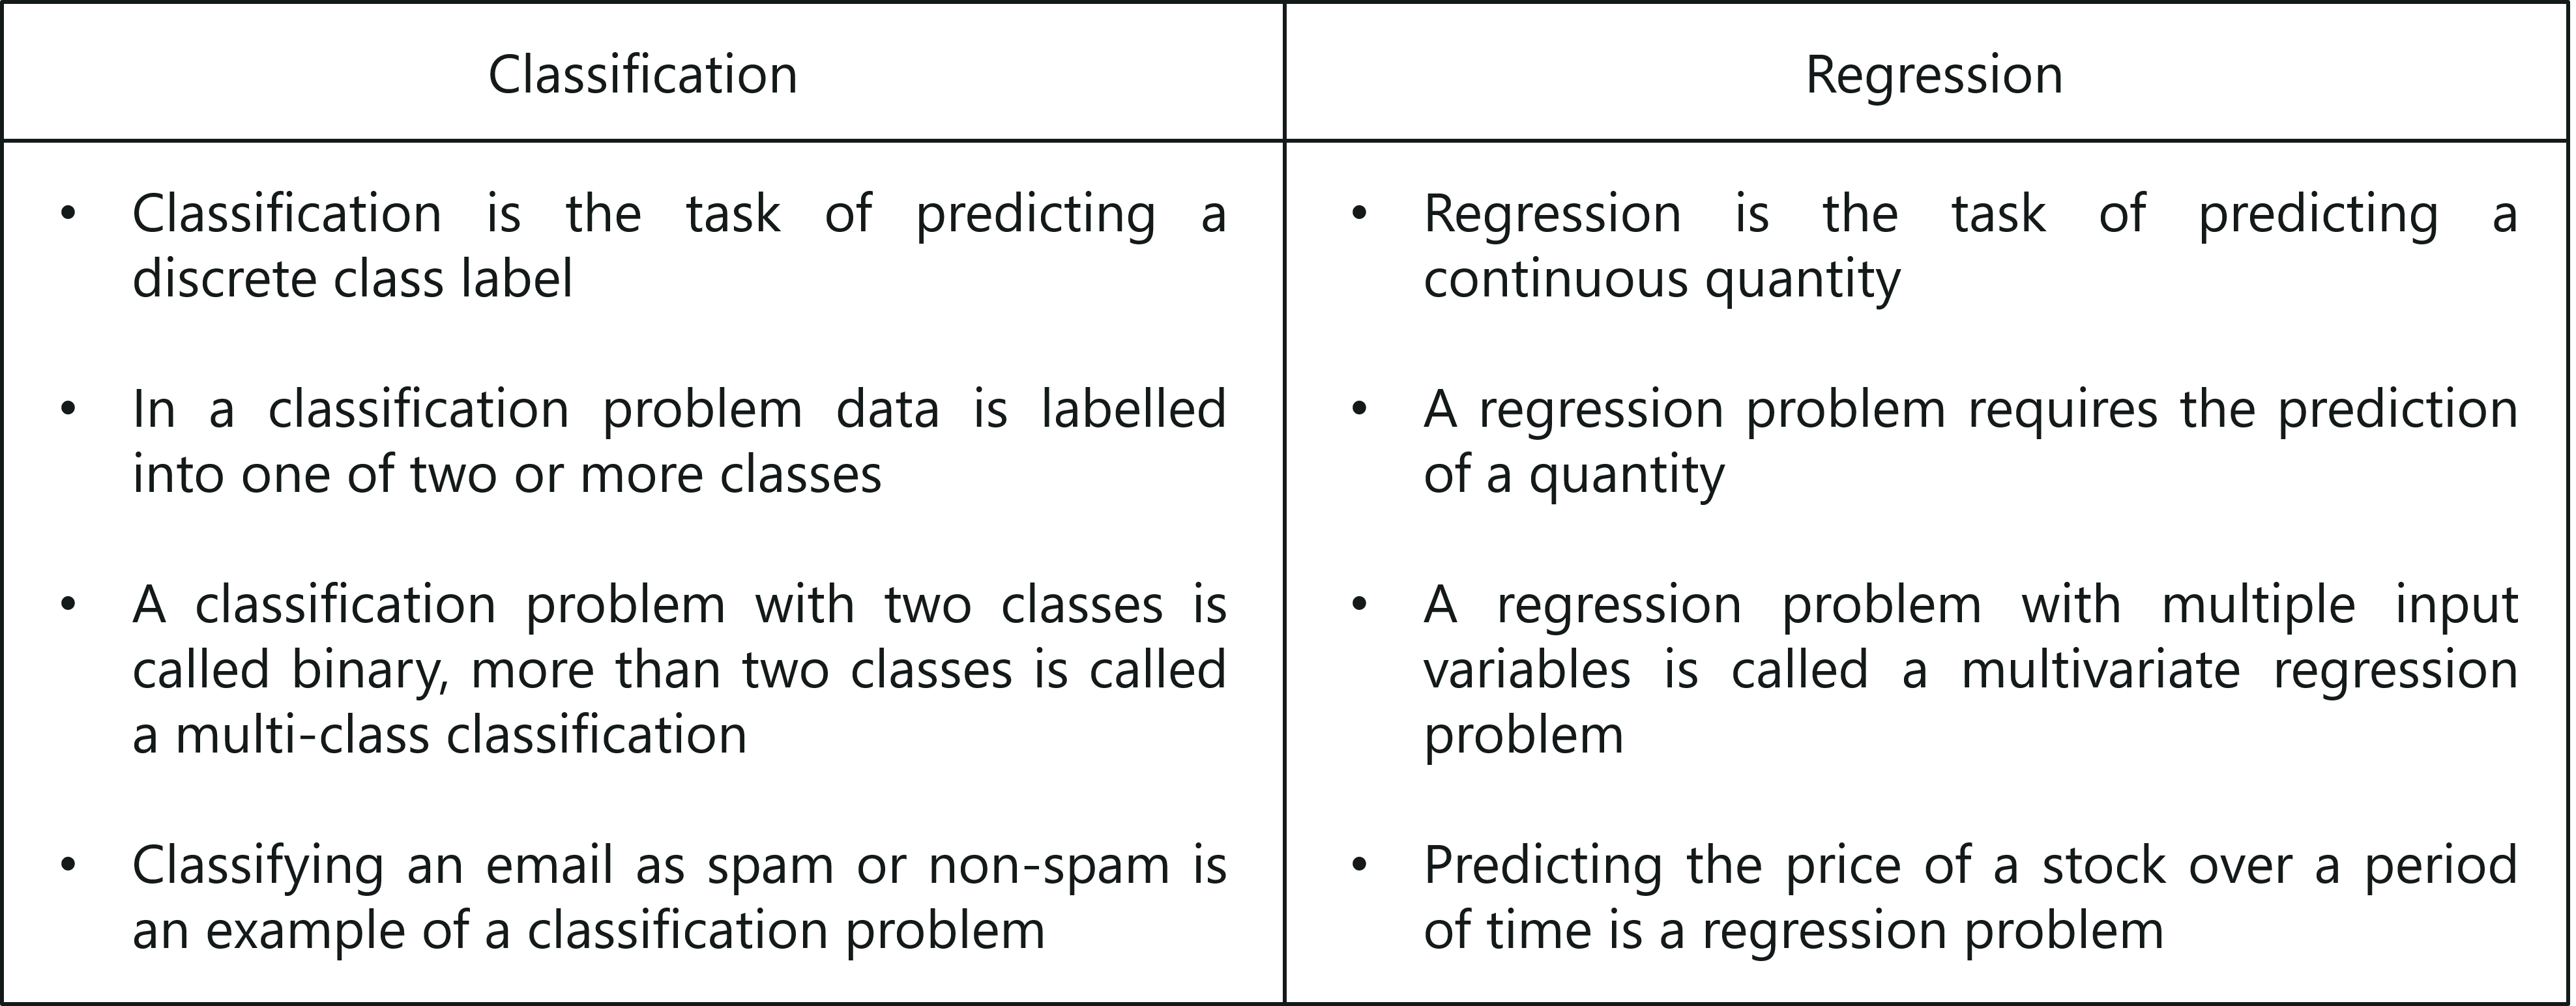
Regression and classification are both related to prediction, prediction from labelled data i.e. supervised learning. Regression predicts a continous numerical value, whereas classification predicts the ‘belonging’ to the class.
So, the idea of Classification Algorithms is pretty simple. You predict the target class by analyzing the training dataset. This is one of the most essential concepts you need to study when you learn data science.

What is Classification? We use the training dataset to get a boundary conditions that could be used to determine each target class. Once the boundary conditions are determined, the next task is to predict the target class. The whole process is known as classification.

Examples:
- Analysis of the customer data to predict whether one will buy computer accessories (Target class: Yes or No)
- Classifying fruits from features like color, taste, size, weight (Target classes: Apple, Orange, Cherry, Banana)
- Gender classification from hair length (Target classes: Male or Female)
Basic Terminology in Classification Algorithms
- Classifier: An algorithm that maps the input data to a specific category.
- Classification model: A classification model tries to draw some conclusions from the input values given for training. It will predict the class labels/categories for the new data.
- Feature: A feature is an individual measurable property of a phenomenon being observed.
- Binary Classification: Classification task with two possible outcomes. Eg: Gender classification (Male/Female)
- Multi-class classification: Classification with more than two classes. In multi-class classification, each sample is assigned to one and only one target label. Eg: An animal can be a cat or dog but not both at the same time.
- Multi-label classification: Classification task where each sample is mapped to a set of target labels (more than one class). Eg: A news article can be about sports, a person, and location at the same time.
Applications of Classification Algorithms
- Email spam classification
- Bank customers loan pay willingness prediction.
- Cancer tumor cell identification.
- Sentiment analysis
- Drugs classification
- Facial keypoints detection
- Pedestrian detection in automotive car driving.
Classification Algorithms Examples:
- Linear Classifiers
- Logistic regression
- Naive Bayes classifier
- Support vector machines
- Quadratic classifiers
- k-nearest neighbor
- Decision trees
- Random forests
- Neural networks
Classification vs Regression
Let me explain this with the help of an example, suppose we are prediting a score ranging between 0 to 1 based on some input features. Now, we can built classification on top of regression, how? if score is greater than 0.5, then we can say class is equal to ‘a’ else class is equal to ‘b’, this is how we can turn a regression into a classification.
Though usually the difference in regression and classification is the loss function. In regression and classification, the goal of the optimization algorithm is to optimize the output of the loss function.
In regression, the loss function increases the further you are away from the correct value for a training instance. In classification, typically the value only increases if you predict the wrong class, and is zero for the right class. The effect is that classification only “cares” if it gets the right class, and there is no since of how “close” it was (or how confident might be another way to think about it), whereas regression’s “goal” is to predict the training values as closely as possible.
Let us use anoother example of house price prediction, we can use regression to predict the price of a house depending on the ‘size’ (sq. feet) and ‘location’ of the house, the proce will be a ‘numerical value’- This relates to regression. Similarly, if instead of the prediction of price, we try to predict the classes such as the price can be classified in labels such as , ‘very costly’, ‘costly’, ‘affordable’, ‘cheap’, and ‘very cheap’ - This relates to classification. Each class may correspond to some range of values.

Algorithms for classification
- Decision Trees
- Logistic Regression
- Naive Bayes
- K Nearest Neighbors
- Support vector Machines
- Random Forests
- many more…
We will be exploring these algorithms in the next coming tutorials.
Evaluation Metrics for Classification Algorithms
How do we evaluate classification models?
Accuracy
Accuracy is one metric for evaluating classification models. Informally, accuracy is the fraction of predictions out model got right. Formally, accuracy has the following definition:
$Accuracy = \frac{Number\ of\ correct\ predictions}{Total\ number\ of\ predictions}$
For binary classification, acccuracy can also be caclulated in terms of positives and negatives as follows:
$Accuracy = \frac{TP + TN}{TP + TN + FP + FN}$
Accuracy alone doesn’t tell the full stroy when you’re working with a class-imbalanced data set where there is a significant disparity between the number of positive and negative labels.
- Accuracy
- the fraction of predictions we got right Accuracy Can Be Misleading
In many cases, accuracy is a poor or misleading metric
- Most often when different kinds of mistakes have different costs
- Typical case includes class imbalance, when positive or negatives are extremly rare
A ROC Curve
An ROC curve(receiver operating characteristic curve) is a graph showing the performance of a classification model at all classification threshold. This curve plots two parameters:
- True Positive Rate: $TPR = \frac{TP}{TP + FN}$
- False Positive Rate: $FPR = \frac{FP}{FP + TN}$
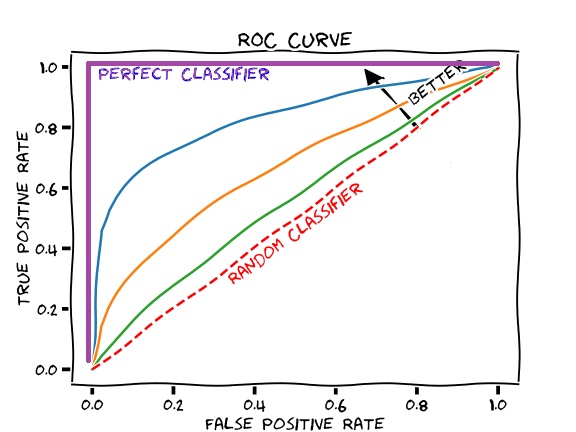
In a Receiver Operating Characteristic (ROC) curve the true positive rate (Sensitivity) is plotted in function of the false positive rate (100-Specificity) for different cut-off points. Each point on the ROC curve represents a sensitivity/specificity pair corresponding to a particular decision threshold.
Each point is the TP and FP rate at one decision threshold
True vs False and Positive vs Negative
A true positive is an outcome where the model correctly predicts the positive class. Similarly, a true negative is an outcome where the model correcly predicts the negative class.
A false positive is an outcome where the model incorrectly predicts the positive class. And a false negative is an outcome where the model incorrectly predicts the negative class.
True Positives and False Positives
For class-imbalanced problems, useful to separate out different kinds of errors
| True Positives </br> We correctly called wolf! </br> We saved the town | False Positives </br> Error: we called wolf falsely </br> Everyone is mad as us |
| False Negatives </br> There was a wolf, but we didn’t spot it </br> It ate alll our chickens | True Negatives </br> No wolf, no alarm </br> Everyone is fine |
Precision and Recall
Precision
Precision attemps to answer the following question:
What proportion of positive identifications was actually correct?
$Precision = \frac{TP}{TP + FP}$
Recall
Recall attemps to answer the following question:
What proportion of actual positive was identified correctly
$Recall = \frac{TP}{TP + FN}$
Precision: (True Positives) / (All Positive Predictions)
- When model said “positive” class, was it right?
- Intuition: Did the model cry “wolf” too often?
Recall: (True Positive) / (All Actual Positives)
- Out of all the possible positives, how many did the model correctly identify?
- Intuition: Did it miss any wolves?
AUC
AUC stands for “Area under the ROC Curve” That is, AUC measures the entire two-dimensional area underneath the entire ROC curve from (0, 0) to (1, 1)
AUC: Area under the ROC Curve
- Interpretation
- If we pick a random positive and a random negative, what’s the probability my model ranks them in the correct order?
- Intuition: gives an aggregate measure of performance aggregated across all possible classification thresholds
AUC is desirable for the following two reasons:
- AUC is scale-invariant. It measures how well predictions are ranked, rather than their absolute values
- AUC is classification-threshold-invariant. It measures the quality of the model’s predictions irrespective of what classification threshold is chosen.
However, both these reasons come with caveats, which may limit the usefulness of AUC in certain use cases:
- Scale invariant is not alwasy desirable
- Classification-threshold-invariant is not always desirable.
Prediction Bias
Prediction bias is a quantity that measures how far apart the average of predictions and average of observations are. That is:
prediction bias = average of predictions - average of labels in data set
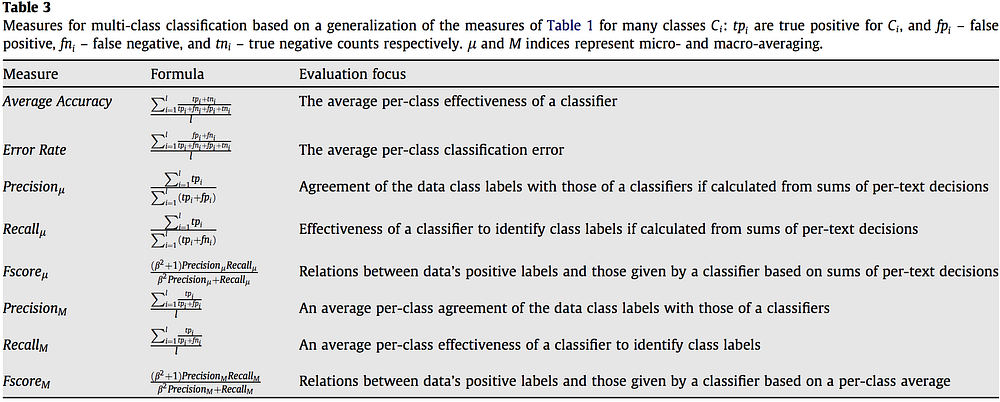
Major Metrices with formula and Evaluation focus
Want to support this project? Contribute.. 